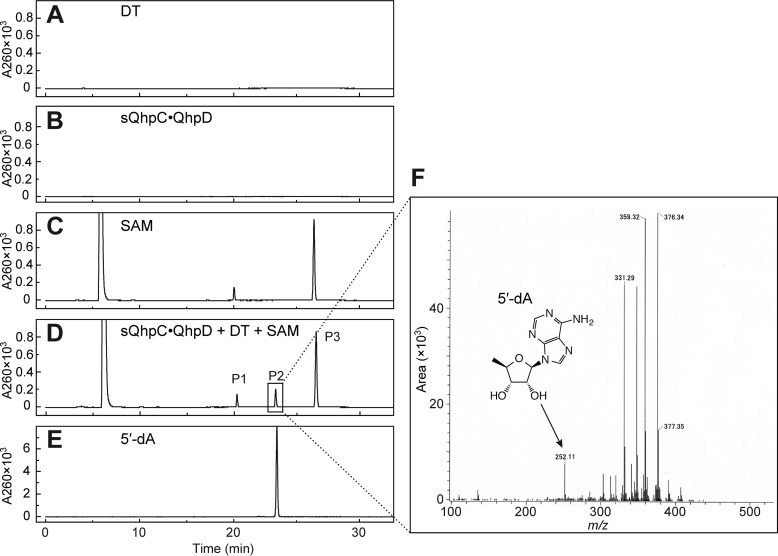
FIGURE 7.
Analysis of 5′-dA produced in the SAM cleavage reaction by QhpD. After TCA quenching and removal of the precipitated proteins, the reaction mixtures were analyzed by reversed-phase column chromatography using Cosmosil 5C18-PAQ column (Nacalai Tesque) equipped on an HPLC system: A, DT; B, sQhpC·QhpD; C, SAM; D, sQhpC·QhpD + DT + SAM; E, 5′-dA standard. The elution was monitored at absorbance at 260 nm. F, P2 peak of sQhpC·QhpD + DT + SAM (D) was collected and analyzed by TOF MS. The peaks with masses larger than that of 5′-dA are assumed to be derived from impurities contaminated during the procedure.

