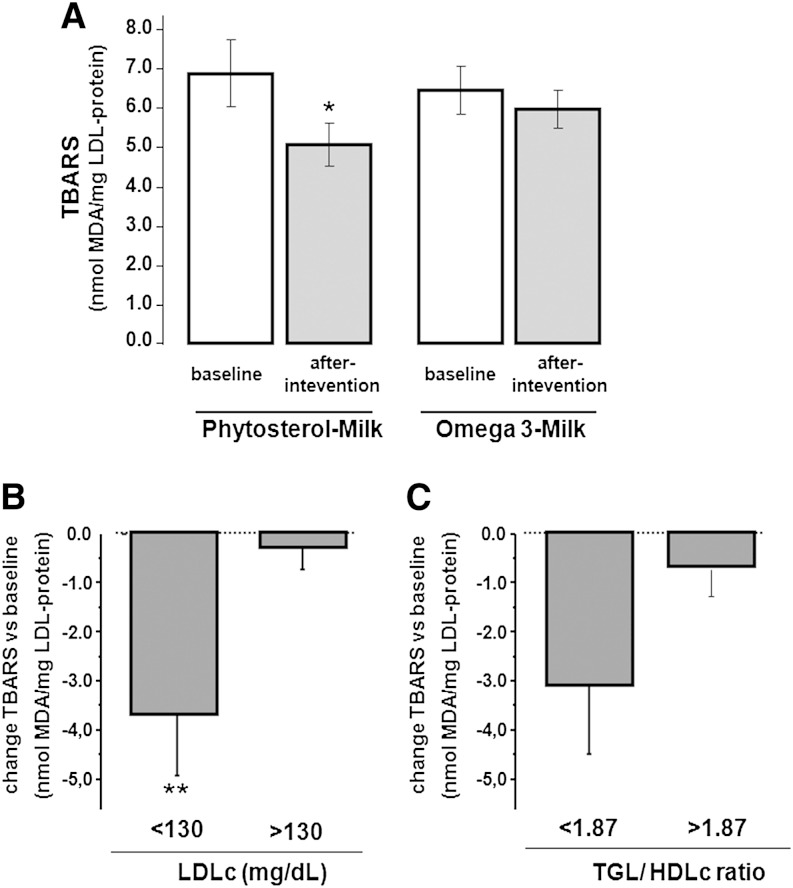
Fig. 2.
Level of TBARSs for in vitro oxidized LDL at baseline and after PhyS- and ω3-milk interventions. A: Bar diagram refers to the level of TBARSs expressed as nanomoles of MDA obtained from LDL (1 μg/ml) incubated with 5 μM Cu2+. B: Changes in TBARSs (from baseline) in the Low- and High-LDL subgroups (plasma LDLc <130 mg/dl and >130 mg/dl, respectively). C: Changes in TBARSs (from baseline) in the subgroups with TGL/HDL ratios below/above the median cut-off value (1.87). *P < 0.05, **P < 0.001 compared with baseline.

