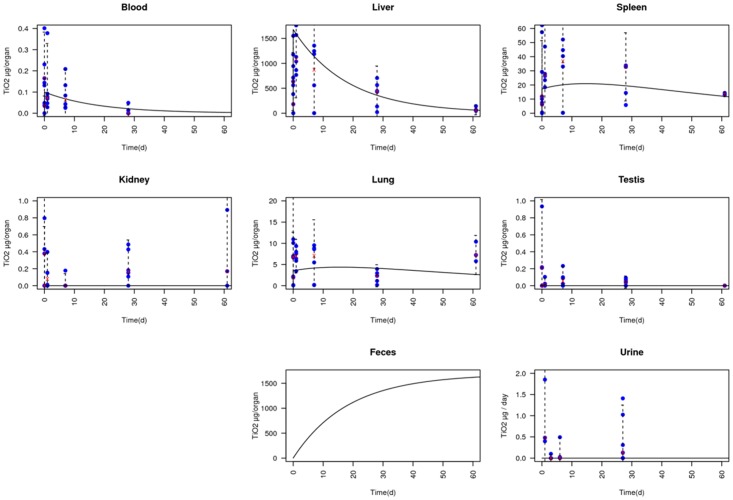
Fig 4. Data correlation in compartmental model.
Data are represented as blue crosses. Means of data at each time are represented as pink dots. Confidence interval at 95% is represented by a dotted line (Mean ± 1.96 × SD). Results obtained with the compartmental model are represented as a black line.

