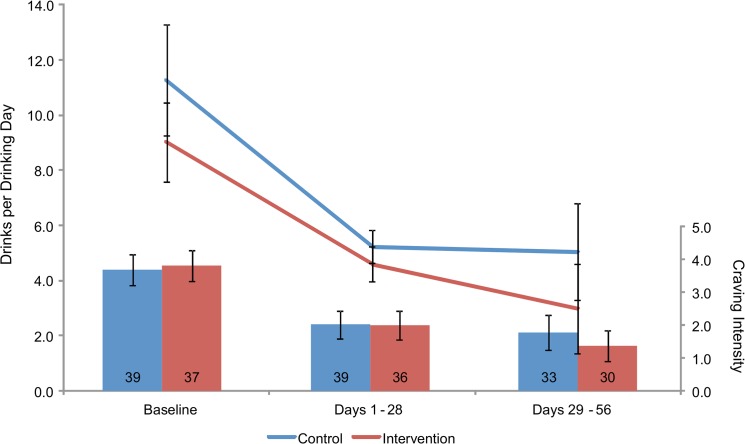
Fig 3. Changes in Self-Reported Drinking and Craving.
95% confidence intervals around the mean numbers of self-reported drinks per drinking day (line graph) and ratings of alcohol craving intensity (column graph), assessed via smartphone, among heavy drinkers randomly assigned to the intervention or control condition. The number of participants making at least one report for each time frame is the number shown in the columns.

