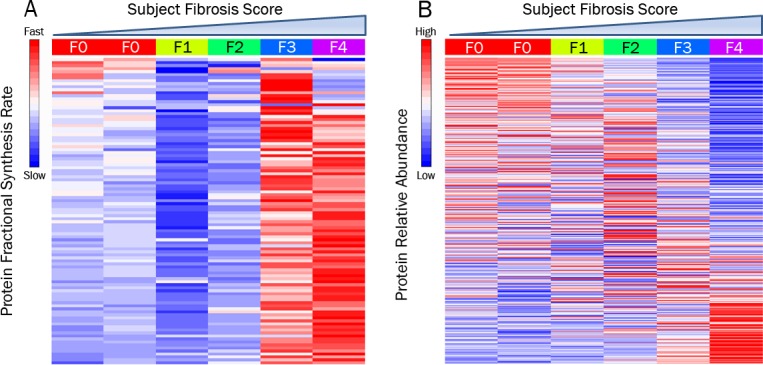
Fig 2. Hepatic Protein Turnover Rate vs Abundance.

Heat maps displaying hepatic protein FSR (A) and relative abundance (B) for 6 human subjects with chronic liver disease. Protein data are row-scaled, with the columns representing each subject sorted by increasing histological fibrosis score. Abbreviation: fractional synthesis rate (FSR).
