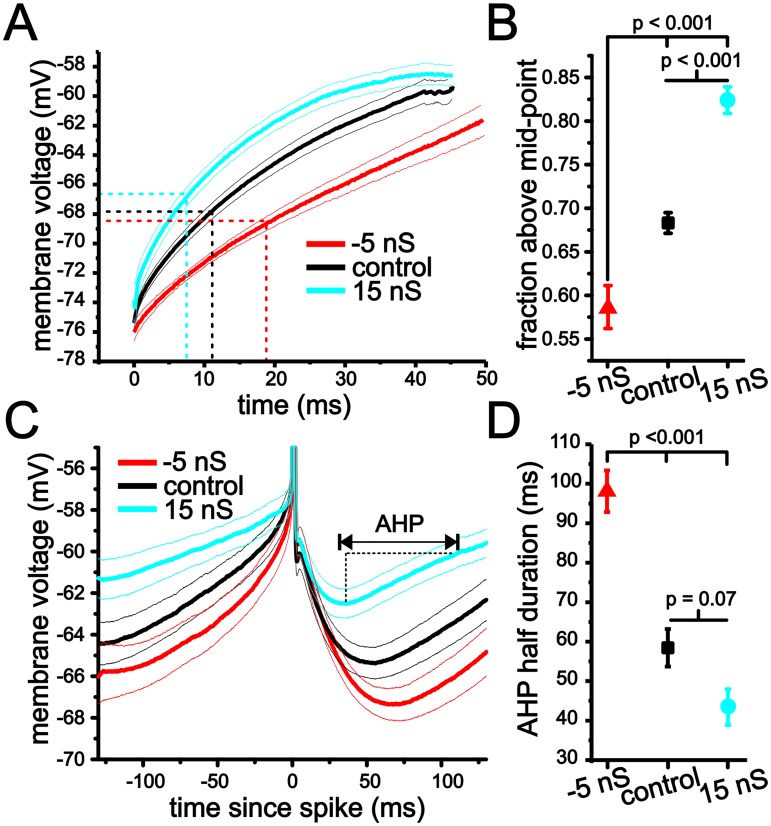
Fig 10. Changes in initial spike and interspike interval voltage trajectory using dynamic clamp.
(A) Average membrane voltage trajectories for initial spike approach in stellate cells under -5 nS (red), control (black) and 15 nS of artificial membrane conductance added with dynamic clamp. Finer lines indicate sem. (B) Plot of average fraction above mid-point for initial spike voltage trajectories using -5 nS, control and 15 nS levels of artificial membrane conductance. (C) Average membrane voltage trajectories in stellate cells using dynamic clamp with -5 nS (red), control (black) and 15 nS (blue) of artificial membrane conductance. (D) Plot of average AHP half duration for the interspike interval voltage trajectories under -5 nS, control and 15 nS of artificial membrane conductance.

