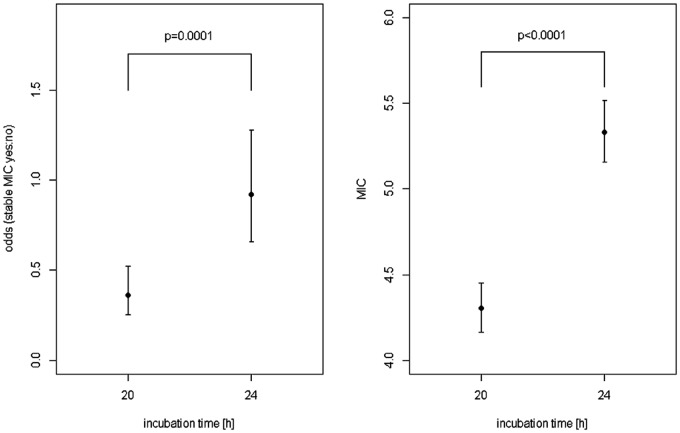
Fig 3. In the left graphic odds and the corresponding 95%-confidence intervals for stable MIC values split by incubation time are shown.
Geometric means and corresponding 95%-confidence intervals for MIC values depending on incubation time are presented in the right graphic. Odds and geometric means are adjusted for bacteria strain and antibiotic agent.

