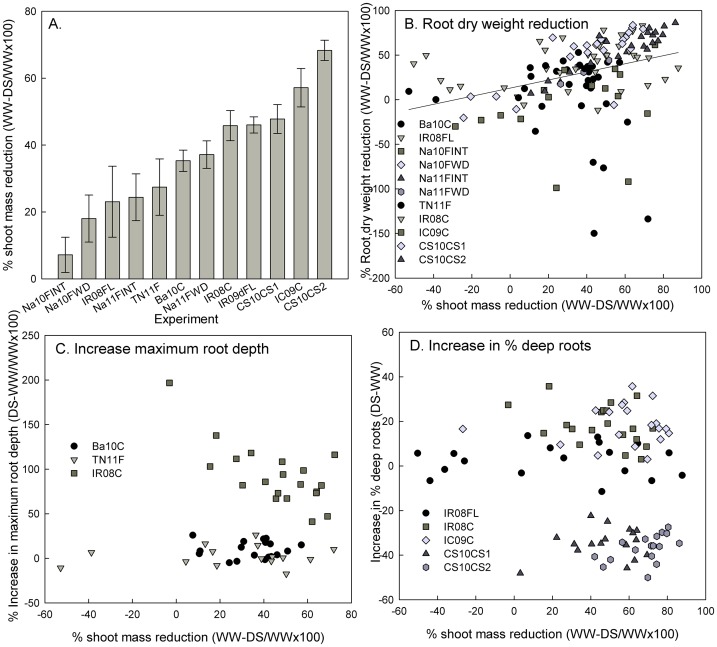
Fig 2. Comparison of genotypic response to drought severity across experiments.
A) Shoot mass reduction in the drought treatment compared to the well-watered control. Response of B) root dry weight, C) maximum root depth, and D) % deep roots to increasing drought severity, as indicated by shoot mass reduction. Each data point represents the average difference between DS and WW treatments for one genotype in one experiment. Data previously reported by Henry et al (2011) and Gowda et al (2012) were used to calculate some of the results shown in this figure.

