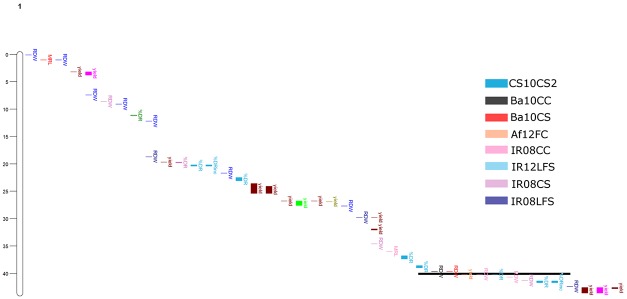
Fig 6. A genomic region on chromosome 1 (39.7–40.7 Mb) was identified as a hot spot in which root dry weight, percent deep roots, and yield aligned.

Colors indicate each experiment from which the phenotypic data and introgression regions were correlated. Experiments from which introgression regions fell within the hot spot are identified in the legend.
