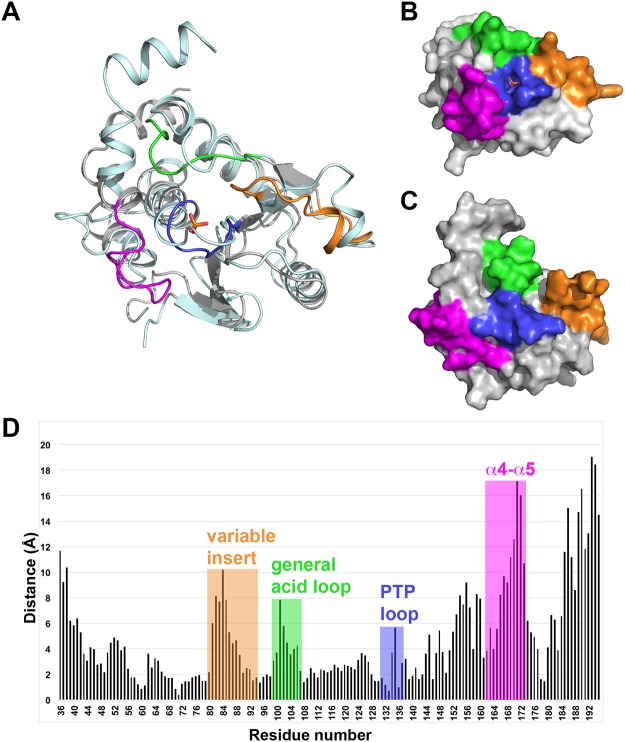
Fig 4. Comparison of TpbA in the ligand-bound and ligand-free state.
A: Superposition of TpbA in the ligand-bound and ligand-free states. Ligand-bound TpbA is coloured grey and functionally important loops are coloured as described in Fig 2. Ligand-free TpbA is coloured pale cyan. B and C: Surface representations of TpbA in the ligand-bound and ligand-free (PDB ID: 2M3V) states, respectively. Functionally important loops are coloured as described in Fig 2. D: Histogram showing the distance (Å) between equivalent residues in the ligand-bound and ligand-free structures.

