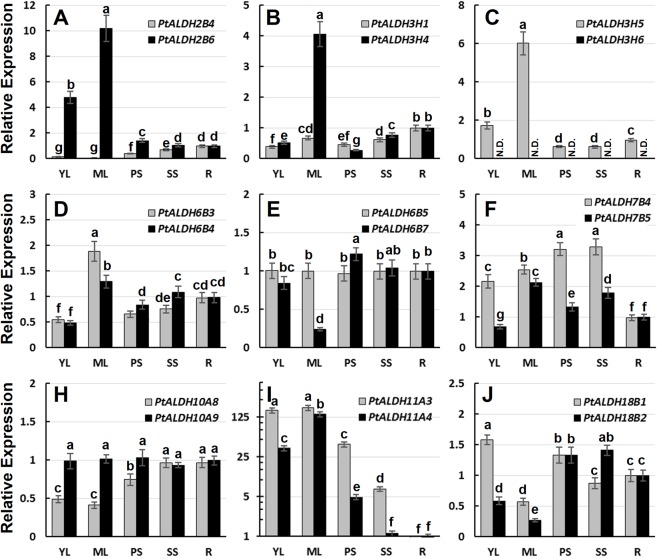
Fig 6. Expression analysis of nine PtALDH gene pairs in different tissues using qRT-PCR.
The relative mRNA abundance of nine PtALDH gene pairs were quantified in vegetative tissues (YL, young leaves; ML, mature leaves; PS, primary stem; SS, secondary stem; R, roots). The average expression of each gene was calculated relatively to the first biological replicate of roots ± standard error (SE) (n≥3). Relative expression represents log2 expression values. Bars with the same letters are not significantly different according to Duncan test and Fisher’s protected LSD test (P<0.05).

