
Fig 6. The blot key from left to right in panel A shows both the un-cleaved (37KDa) and cleaved (25KDa) caspase-3 bands in kidney homogenates from rats after their treatment with chrysin 10 mg/kg, chrysin 10 mg/kg + adenine, chrysin 50 mg/kg, chrysin 50 mg/kg + adenine, chrysin 250 mg/kg, chrysin 250 mg/kg + adenine, saline (control), and adenine using Western blot analysis.
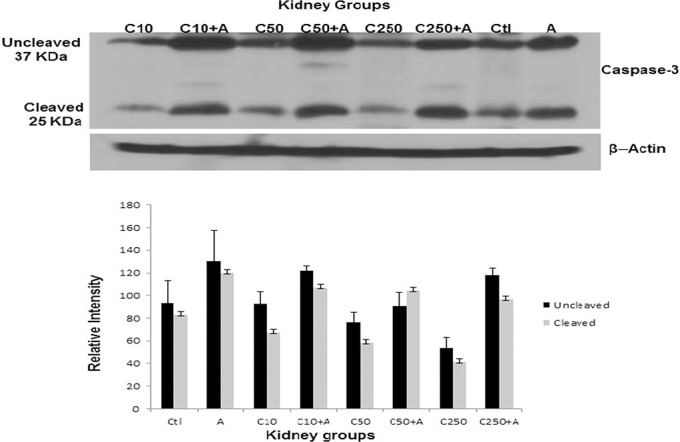
The graph in panel B represents the densitometry measurement of both the un-cleaved and cleaved caspase-3 bands in kidney homogenates from all treated and non-treated rats.