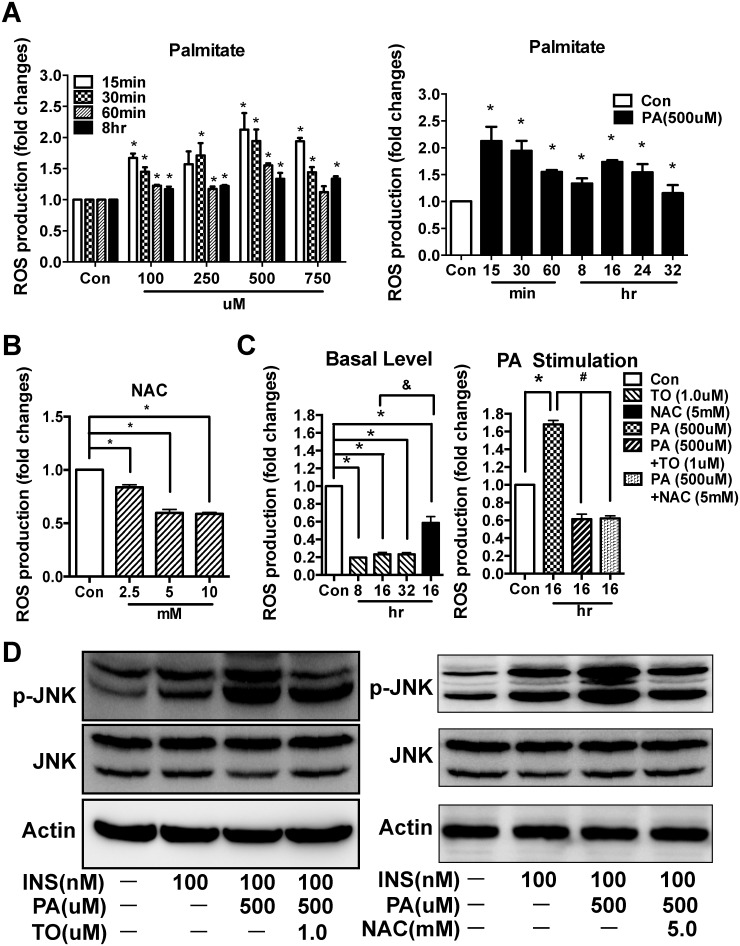
Fig 6. TO901317 (TO) inhibited the ROS production and JNK phosphorylation in Palmitate-treated HepG2 cells.
(A) Left panel: HepG2 cells were incubated with palmitate (PA) in various doses [100, 250, 500 and 750 μM; control (no treatment)] for different periods of times (15, 30, 60 minutes, and 8 hr), respectively. Intracellular ROS production was quantified using the fluorescent probe DCFH-DA. PA treatment increased the ROS production in a dose dependent manner when concentration is 500 μM or lower; and this elevation was sustained for up to 8 hr. Right panel: Since 500 μM of PA was most potent in inducing ROS production as shown in the left panel, we further tested if PA (500 μM) has prolonged effects (at 8, 16, 24, 32 hr time points). Indeed, the PA stimulated ROS sustained for up to 32 hr. (B) HepG2 cells were incubated for 16hr with increasing concentrations of NAC (0, 2.5, 5,10 mM), a positive control for ROS suppression. NAC treatment decreased ROS production in a concentration dependent manner. (C) HepG2 cells were either incubated with TO (1.0 μM) for 8, 16, 32 hr or with 5 mM NAC for 16 hr (Left panel); or incubated for 16 hr with PA (500 μM), PA (500 μM) + TO (1.0 μM), and PA (500 μM) + NAC (5 mM), respectively (Right panel). Under basal (unstimulated condition) (Left panel), TO markedly suppressed the ROS production, with potency higher than NAC. Under PA-stimulated condition (Right panel), TO treatment (for 16 hr) had a similar potency as NAC (16 hr) in suppressing ROS production. (D) Activation of JNK was analyzed by SDS-PAGE and Western blot. Both TO (left panel) and NAC (right panel) suppressed the PA-induced JNK activation/phosphorylation in HepG2 cells. Results in (A), (B), and (C) are presented as mean ± SD, *P<0.05 versus control, &P<0.05 NAC versus TO, #P<0.05 versus PA.

