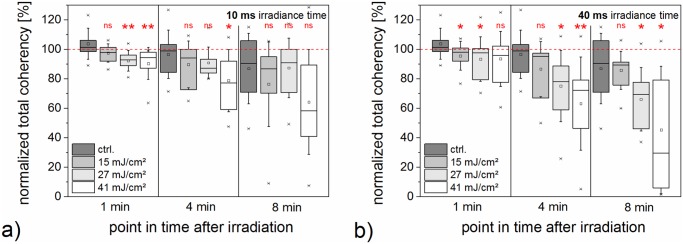
Fig 9. Normalized total coherency of F-actin orientation at distinct points in time after irradiation.

Values are normalized to the coherency before laser irradiation. The unirradiated control is based on the same dataset in both diagrams. A disorientation of the F-actin structure is most pronounced for 27 mJ/cm2 and 41 mJ/cm2 at all three points in time. Additionally, the disorientation increases with time, such that the coherency in the irradiated samples decreases. Data of 10 irradiated cells is shown. Whiskers for box plots depict one standard deviation.
