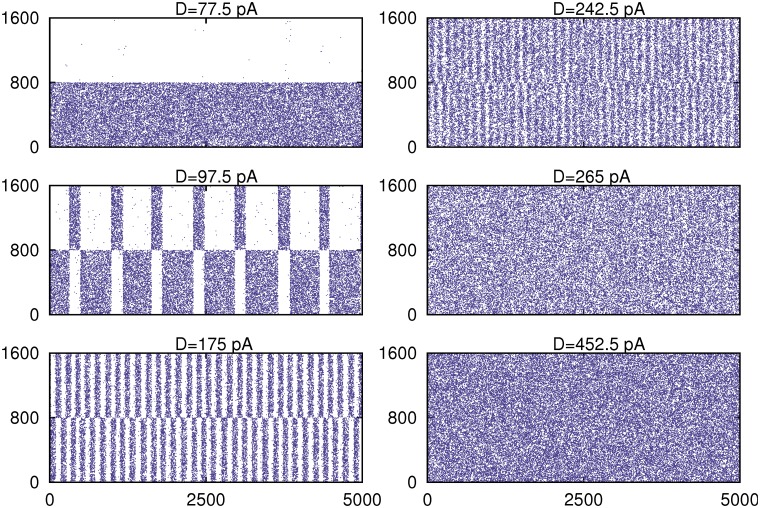
Fig 3. Raster plots of the network activity for different values of the noise intensity D for the network realization with the correlation C(D) depicted in Fig. 1.
The stored pattern in such that for i = 0, …, 799 s i = 1, that is neurons are active, and for i = 800, …, 1600 s i = 0 that is, these neurons are silent in the pattern. At the first maximum of C(D) that occurs around D 1 = 97.5pA there are oscillations of the network activity around the stored pattern and its anti-pattern which are correlated with the weak stimulus. At a second critical level noise D 2 = 265pA a transition between the above oscillatory phase and a disordered phase appears, and a second maximum of C(D) emerges where a very noisy mean activity in the network also is correlated with the weak stimulus. All depicted panels corresponds to the same cases shown in Fig. 2.

