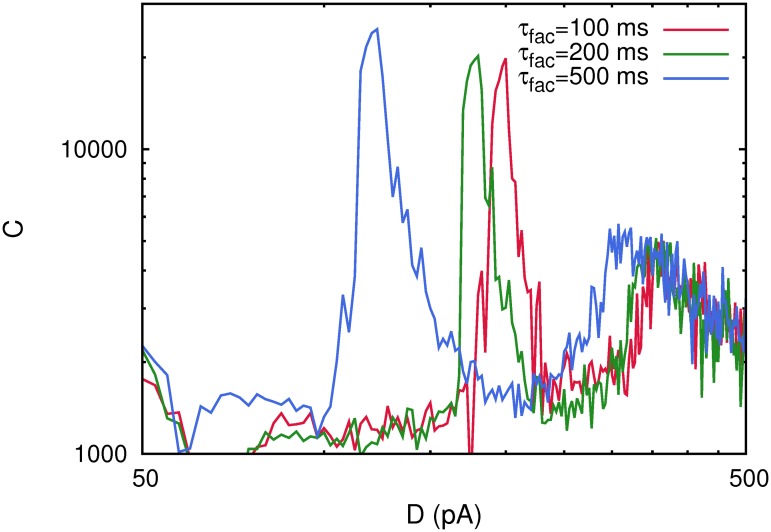
Fig 5. The correlation C(D) obtained for a single realization of the system with N = 800 neurons considering both short-term depression and short-term facilitation processes at the synapses with  = 0.02.
The figure illustrates that both maxima of C(D) appear at lower noise intensities as well as that the amplitude of the first maximum grows when τ fac is increased. Other parameters were as in Fig. 1.

