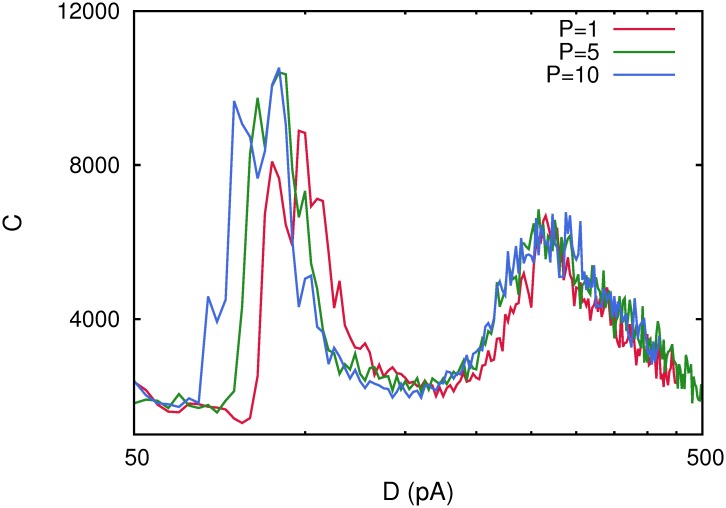
Fig 7. Correlation function C(D) for different number of stored patterns P in a network with N = 2000 neurons.
This shows that as P increases the low-noise maximum of the correlation C(D) increases in intensity and appears at lower level of noise while the second correlation maximum remains unchanged. Each curve has been obtained with a single realization of the corresponding network. Other parameters values were as in Fig. 1.

