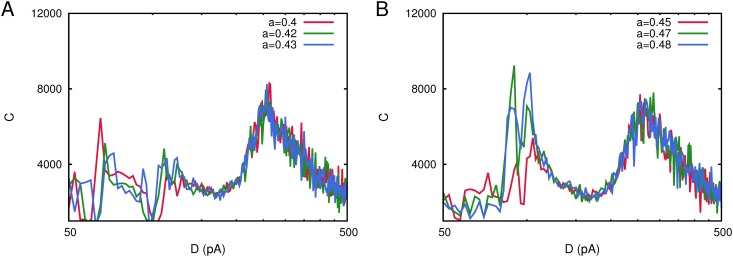
Fig 8. Changes in the shape of the correlation C(D) for a network with N = 800 neurons considering different levels of asymmetry in the network activity encoded in the stored pattern as measured with the parameter a (see main text for the explanation).
Panel A depicts correlation curves for a ≤ 0.45, showing that the correlation C(D) drops around D = 100pA and another maximum starts to emerge at D = 65pA. Panel B illustrates C(D) curves for a ≥ 0.45, showing that the low noise maximum at D = 100pA looses intensity as a decreases. Each curve has been obtained with a single realization of the corresponding network. Other parameters were as in Fig. 1.

