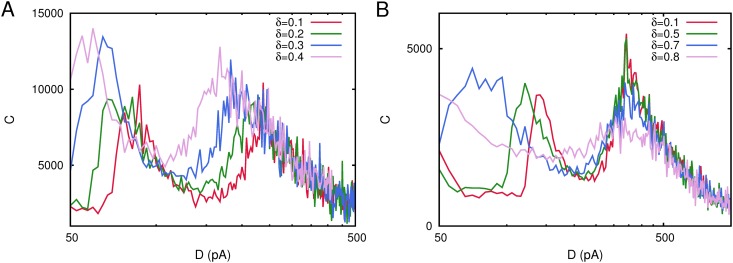
Fig 9. Behavior of the correlation C(D) for a diluted network.
(A) As the fraction δ of removed connections increases both maxima of C(D) appear at lower noise intensity. The network size was set to N = 800 and a factor N instead of ⟨k⟩ is considered in the definition (4). Each curve has been obtained with a single realization of the corresponding network. Other parameters were as in Fig. 1. (B) In this case simulations has been performed considering diluted networks using the same procedure than in panel A, but with less level of synaptic depression, τ rec = 200 ms, and synaptic weights normalized with a factor ⟨k⟩ = (1 − δ)2 N. Also in this case, the corresponding C(D) curves has been obtained for N = 200 and averaging over 10 different networks.

