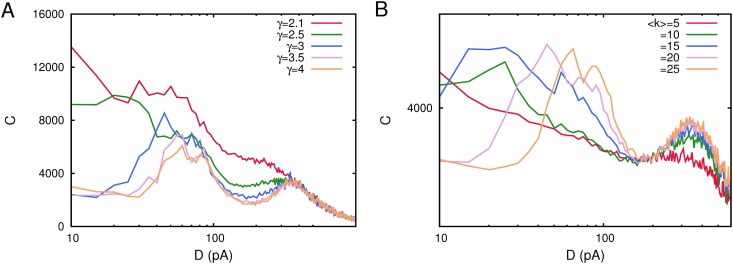
Fig 10. Detection of weak subthreshold stimulus as a function of noise D in spiking networks with complex scale-free topologies.
(A) Correlation curves C(D) obtained for different values of the exponent γ of the degree connectivity distribution p(k) ∼ k −γ in a network with ⟨k⟩ = 20. The figure shows that around γ = 3 multiple maxima in C(D) start to emerge. (B) The same correlation curves C(D) for scale free networks with p(k) ∼ k −3 and different values of the mean connectivity degree ⟨k⟩. Again for more realistic large values of ⟨k⟩ around 20 multiple maxima in C(D) start to appear. All curves have been obtained for τ rec = 200 ms in a network with N = 200 neurons and after averaging over 10 different network realizations. Other parameters as in Fig. 1.

