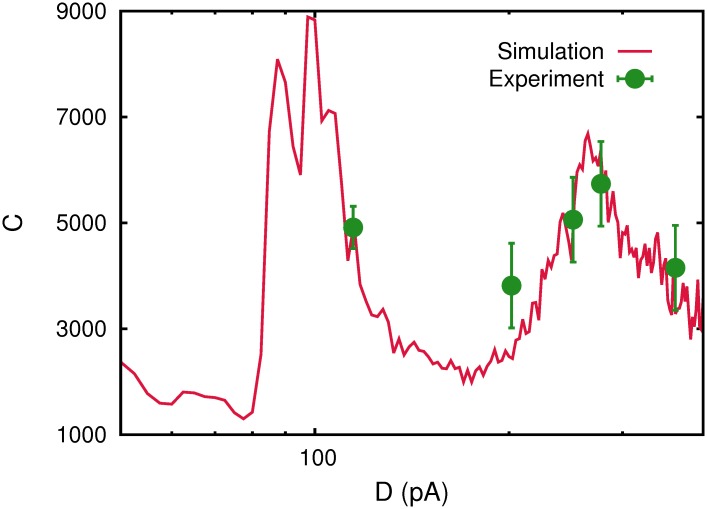
Fig 13. Fitting experimental data in the auditory cortex to our model.
The experimental data (symbols with the corresponding error bars) reported in [8] are compared as a function of noise with the correlation function C(D) described in Fig. 1 corresponding to a single realization of a spiking network of N = 2000 integrate and fire neurons (red solid line) and dynamic synapses. The experimental data C (in arbitrary units) has been multiplied by a factor 104, and the noise amplitude M (in dB) has been transformed in our noise parameter D using the nonlinear relationship with D 0 = 0.1pA, η = 0.71(pA/dB), M 0 = 50dB and σ M = 140dB.

