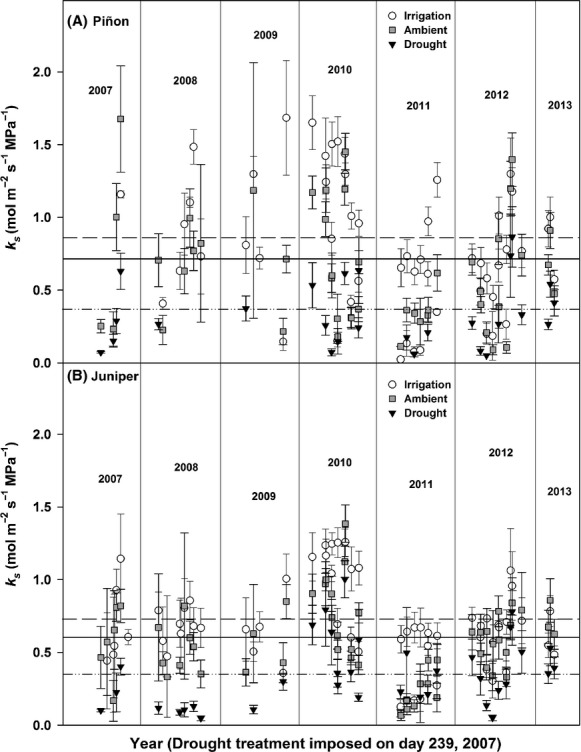
Figure 4.

Plant hydraulic conductance patterns (ks) for irrigation, ambient, and drought treatments across the 5+ year study period (panel A – piñon, panel B – juniper). Horizontal lines indicate 5+ year treatment mean for each species as follows: irrigation ( ), ambient (
 ), and drought (
 ). Error bars represent ±1 SE of the mean.
