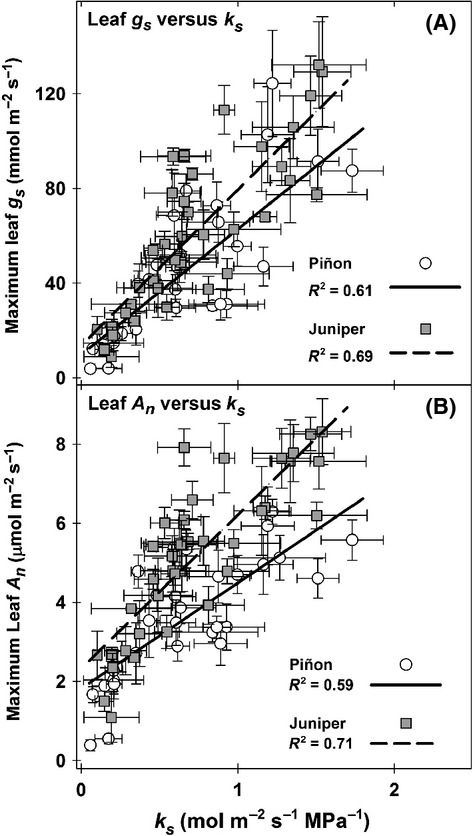
Figure 6.

Relationship between maximum stomatal conductance (gs) and whole-plant ks during years 2010 and 2011 by species (panel A). Relationship between maximum net photosynthesis (An) and whole-plant ks during years 2010 and 2011 by species (panel B). Data points are treatment means on a particular measurement date (±1 SE). All data represent dates when concurrent data from both leaf gas exchange measurements and stem sap-flow measurements (for ks) were available. For each species, a single regression relationship was fit across treatments (see Limousin et al. 2013 for details on the gas exchange sampling effort).
