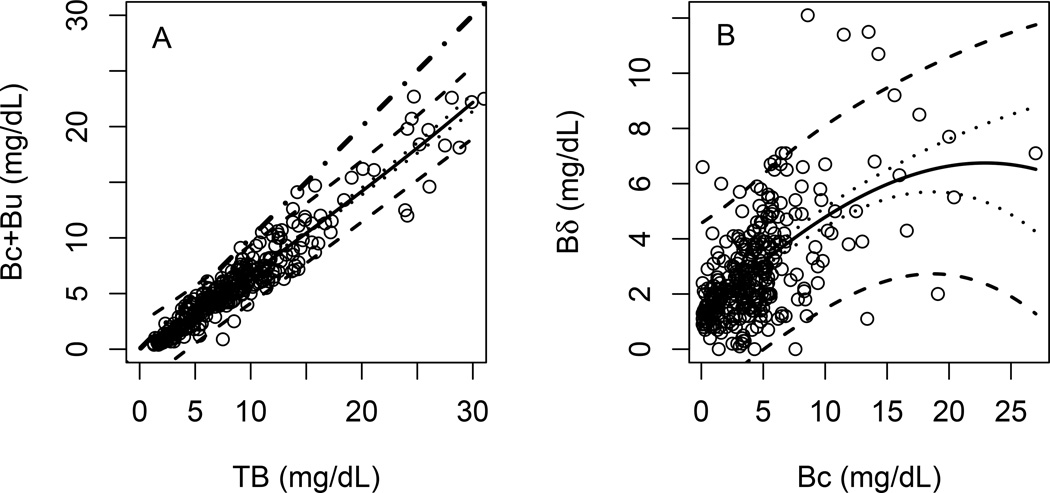
Figure 1. Bδ and other bilirubin species.
A) Dot-dash line is the 45 degree line which indicates the complete identity of values on horizontal and vertical axes. Solid line is the estimated mean of Bc+Bu using LOESS regression. B) Solid line is the estimated mean of Bδ using LOESS regression. Dotted lines are the 95% confidence interval of the predicted mean. Dashed lines are the 95% prediction interval.

