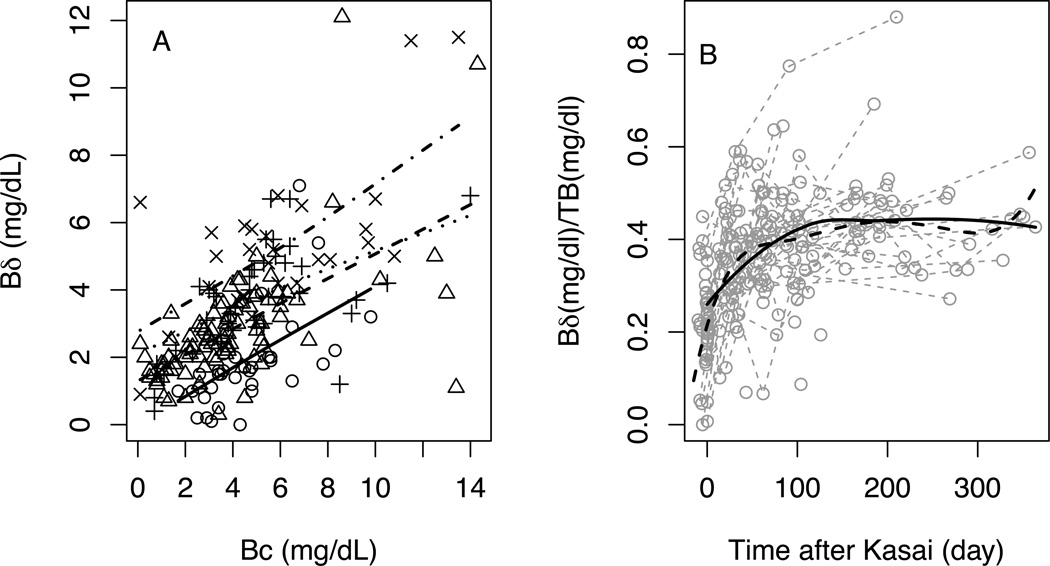
Figure 2. Bδ and Bδ/TB and time in subjects with poor drainage after Kasai surgery.
Circles and solid line – around time of Kasai (2 weeks before to 1 days after Kasai); triangles and dashed line – 2 days to 3 months after Kasai; cross and dotted line – 3 months to 6 months after Kasai;×and dashed and dotted line – 6 months to 1 year after Kasai. All lines are estimated mean of Bδ using linear regression by time windows. B) Grey dotted shows individual trajectories. Solid line is the estimated mean of Bδ/TB using LOESS regression. Dashed line is the estimated mean of Bδ/TB using joint model of longitudinal and survival data for adjusting informative dropout.

