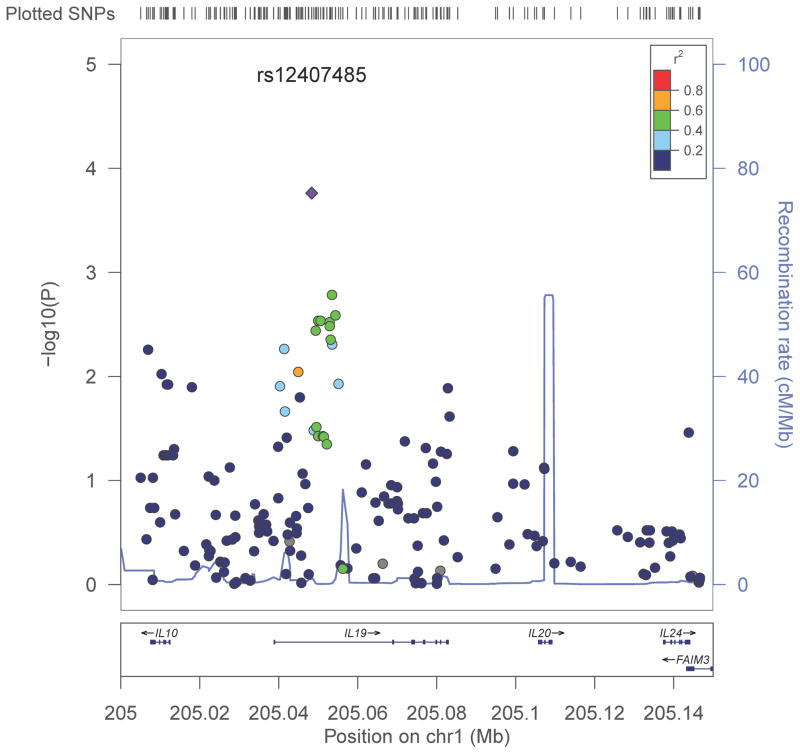
Figure 1.
Manhattan regional plot based on analyses of 190 candidate SNPs in the IL10-IL24 gene cluster. For the aggregated dataset (515 Rwandans and 762 Zambians combined), P values (the Y-axis on the left) are derived from screening models that assume dominant effects for minor alleles (see text). Recombination rates (Y-axis on the right) and linkage disequilibrium measures (color-coded r2 values) correspond to data from Yoruban Africans (the 1000 Genomes Project). The rs12407485 SNP in IL19 is represented by a diamond.

