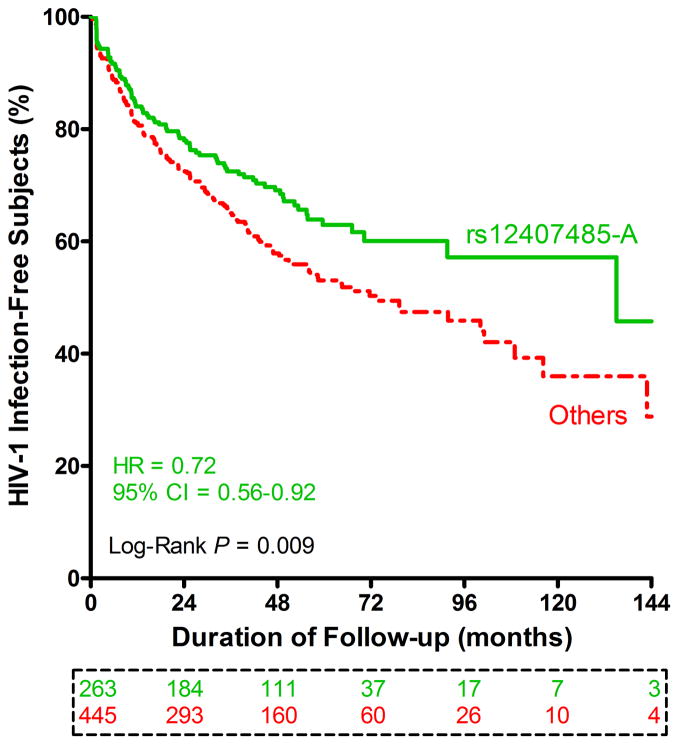
Figure 3.
Immunogenetic influences on HIV-1 seroconversion. Kaplan-Meier curves are based on high-risk subjects (222 Rwandans and 486 Zambians) who are seronegative at enrollment, with stratification by rs12407485 genotypes (GG homozygosity versus GA + AA). Results beyond the first 12 years of quarterly follow-up visits are censored (for lack of remaining subjects). Crude hazard ratio (HR) and 95% confidence intervals (CI) are estimates from a univariable Cox proportional hazards model (no adjustment for other factors). Subjects available at seven major visit intervals are boxed and color coded.

