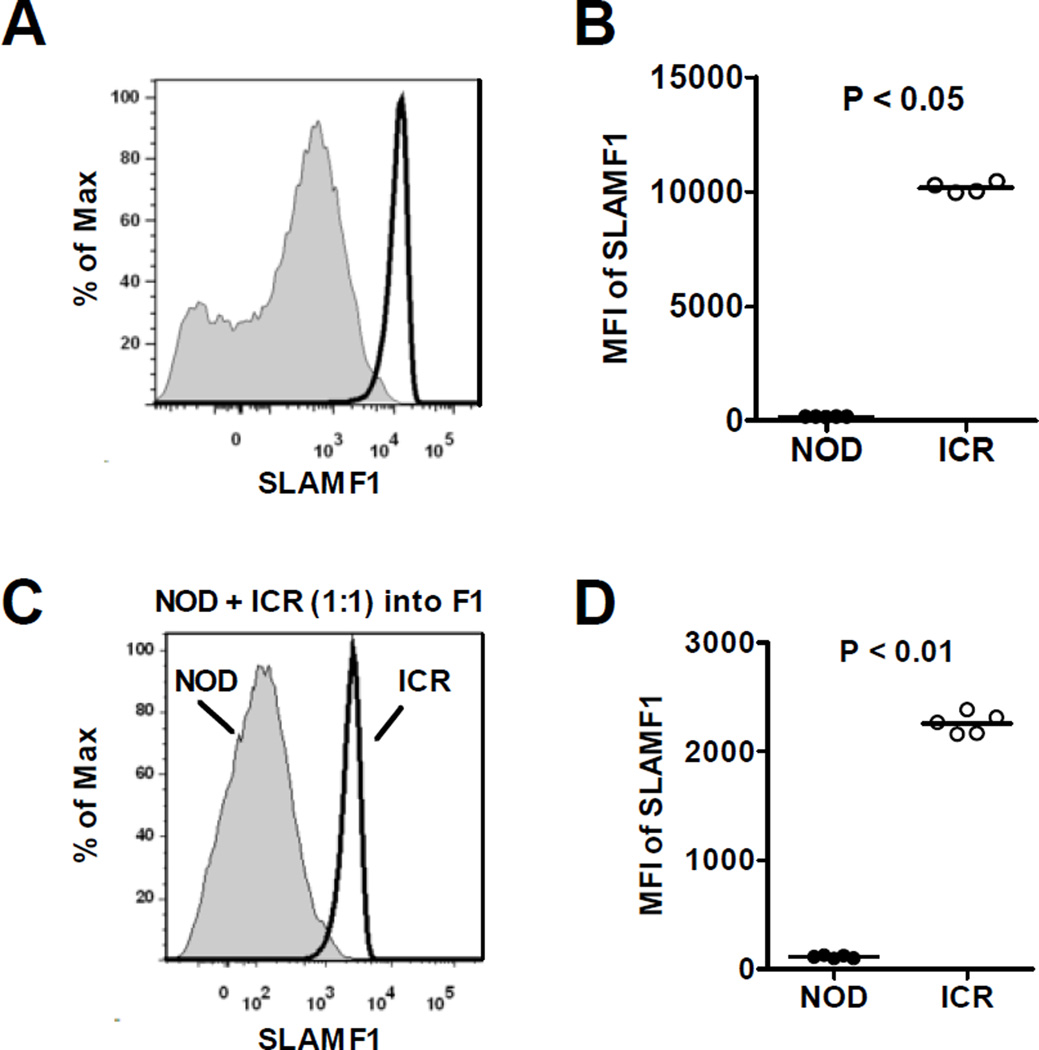
Figure 3. Analyses of SLAMF1 expression.
(A and B) Expression levels of SLAMF1 on DP thymocytes of 7-week-old NOD and ICR males were analyzed by flow cytometry. Representative histograms of SLAMF1 on CD4+/CD8+ gated cells are shown in (A). NOD and ICR mice are respectively indicated by shaded areas and solid lines. Results from 4–5 mice per strain are summarized in (B). (C and D) Expression of SLAMF1 was analyzed on DP thymocytes in NOD/ICR mixed BM chimeras. (C) Representative histograms of SLAMF1 expression (gated on NOD CD45.1+ CD45.2− or ICR CD45.1− CD45.2+ DP thymocytes). (D) The summarized results from 5 BM chimeras are shown. Each symbol represents one mouse. The horizontal bar dictates the mean. Statistical analysis was performed using the Mann Whitney test.

