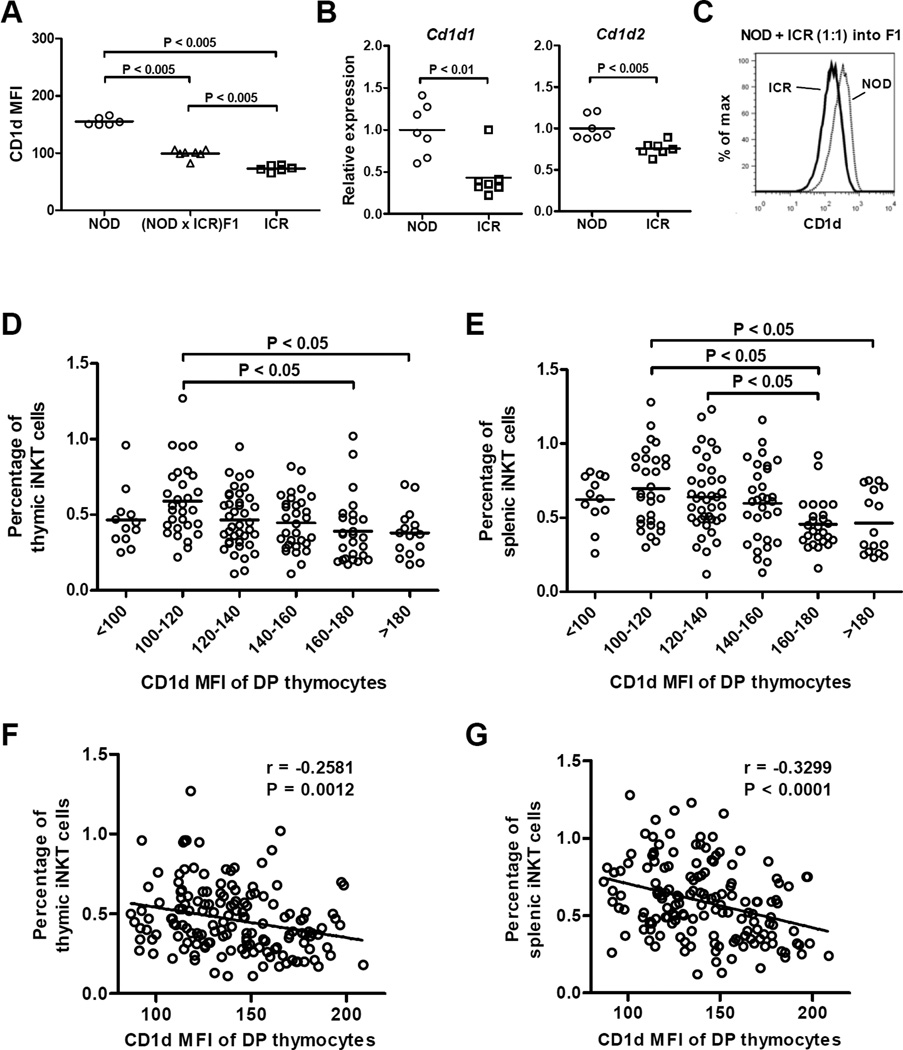
Figure 4. CD1d expression level inversely correlates with the frequency of iNKT-cells.
(A) Flow cytometry analysis of CD1d expression on DP thymocytes of 7-week-old NOD, ICR, and (NOD × ICR)F1 males. Each symbol represents one mouse. The horizontal bar indicates the mean. Statistical analysis was performed using the Mann Whitney test. (B) The relative levels of Cd1d1 (left) and Cd1d2 (right) transcripts in DP thymocytes isolated from NOD and ICR mice. Total RNA was isolated from sorted DP thymocytes and reverse transcribed into cDNA. The abundance of Cd1d1 and Cd1d2 cDNA was determined by qPCR and normalized to that of Gapdh. The results are presented as the fold change relative to the mean of all analyzed NOD mice. Each symbol represents one mouse. The horizontal bar indicates the mean. Statistical analysis was performed using the Mann Whitney test. (C) CD1d expression difference in NOD and ICR DP thymocytes is cell autonomously controlled. NOD and ICR BM cells were mixed at a 1:1 ratio and transferred into lethally irradiated (1100 Rads) (NOD × ICR)F1 recipients. CD1d expression on NOD or ICR derived DP thymocytes was determined by flow cytometry at 9 weeks post BM reconstitution. The representative result of 3 BM recipients is shown. (D and E) A cohort of 163 first backcross (BC1) males were analyzed to test if there is an inverse relationship between CD1d expression level on DP thymocytes and the frequency of iNKT-cells. BC1 mice are grouped based on the expression level of CD1d and the frequencies of thymic (D) and splenic (E) iNKT-cells are statistically compared by one way analysis of variance followed by the Tukey’s multiple comparison test to compare all possible pairs. Each symbol represents one mouse. The horizontal bar indicates the mean. Overall negative correlations were also found between CD1d expression levels on DP thymocytes and iNKT-cell frequencies in the thymus (F) and spleen (G). The corresponding Pearson correlation r and the P value are indicated.

