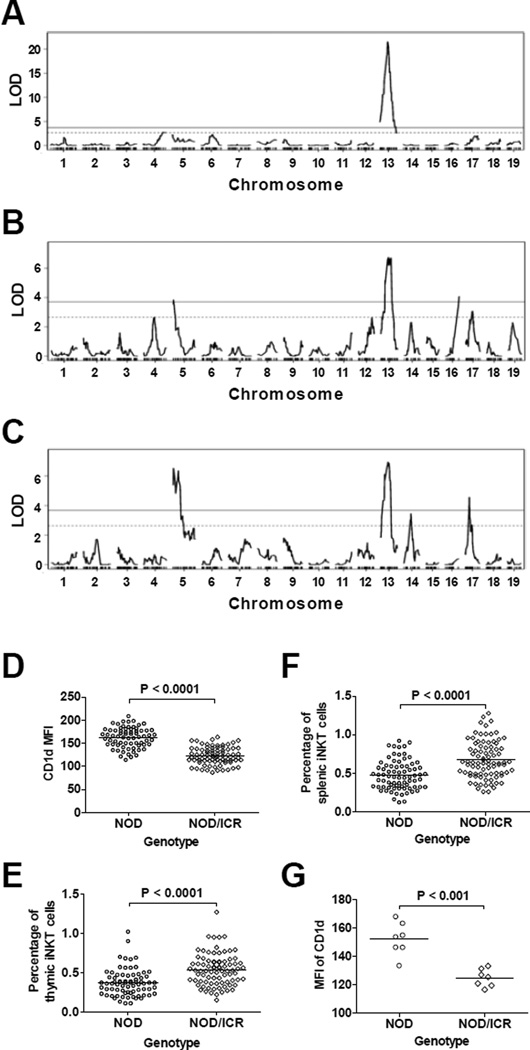
Figure 6. Genetic mapping of CD1d expression and the iNKT-cell frequency.
QTL analysis was performed to map genetic loci that regulate the expression level of CD1d on DP thymocytes and the frequencies of thymic and splenic iNKT-cells. (A) The LOD score plot of CD1d expression on DP thymocytes. (B) The LOD score plot of thymic iNKT-cell frequency among total thymocytes. (C) The LOD score plot of splenic iNKT-cell frequency among total splenocytes. The solid and dashed lines respectively represent the genome-wide adjusted significant (P < 0.01) and suggestive (P < 0.1) LOD score thresholds. (D) The single ICR allele at the Chr 13 peak marker rs29566823 reduced the expression of CD1d on DP thymocytes. Each symbol represents one mouse. The horizontal bar indicates the mean. Statistical analysis was performed using the unpaired t test. (E) The single ICR allele at the Chr 13 peak marker rs46755152 increased the frequency of thymic iNKT-cells. Each symbol represents one mouse. The horizontal bar indicates the mean. Statistical analysis was performed using the unpaired t test. (F) The single ICR allele at the Chr 13 peak marker rs46755152 increased the frequency of splenic iNKT-cells. Each symbol represents one mouse. The horizontal bar indicates the mean. Statistical analysis was performed using the unpaired t test. (G) Independent confirmation of genotype-phenotype (CD1d expression level) association in 14 BC1 mice. The homozygous NOD genotypes at Chr 13 markers rs46755152 and rs13481868 significantly enhanced the expression of CD1d on DP thymocytes. Each symbol represents one mouse. The horizontal bar indicates the mean. Statistical analysis was performed using the Mann Whitney test.

