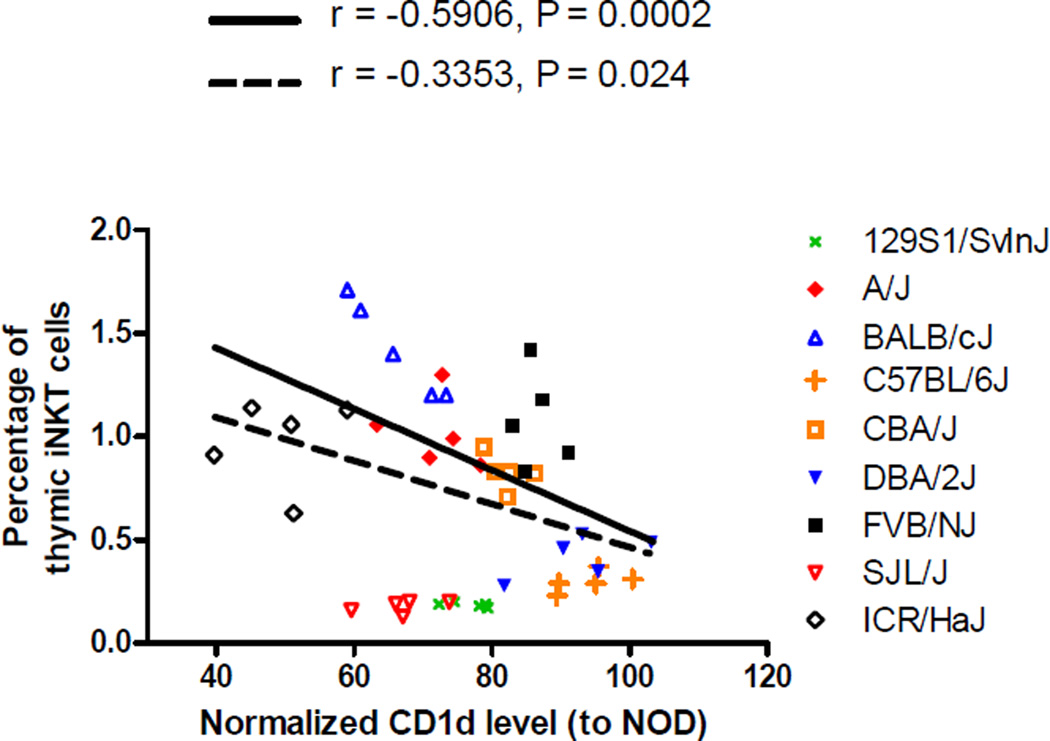
Figure 7. Negative correlation of thymic iNKT-cell frequencies and DP thymocyte CD1d expression levels in a panel of inbred strains.
The proportion of thymic iNKT-cells and the level of CD1d expression on DP thymocytes were determined in 7-week-old males of the indicated strains. For each strain, 5 mice were analyzed side by side with 3 NOD males in the same experiment. The CD1d expression level was then normalized to the mean of the 3 NOD mice. Each symbol represents one mouse. The dotted line represents the best fit linear regression line when all strains are considered. The solid line denotes the best fit liner regression line when 129S1/SvInJ and SJL/J are excluded. The corresponding Pearson correlation r and the P value are also indicated.

