
Figure 2.
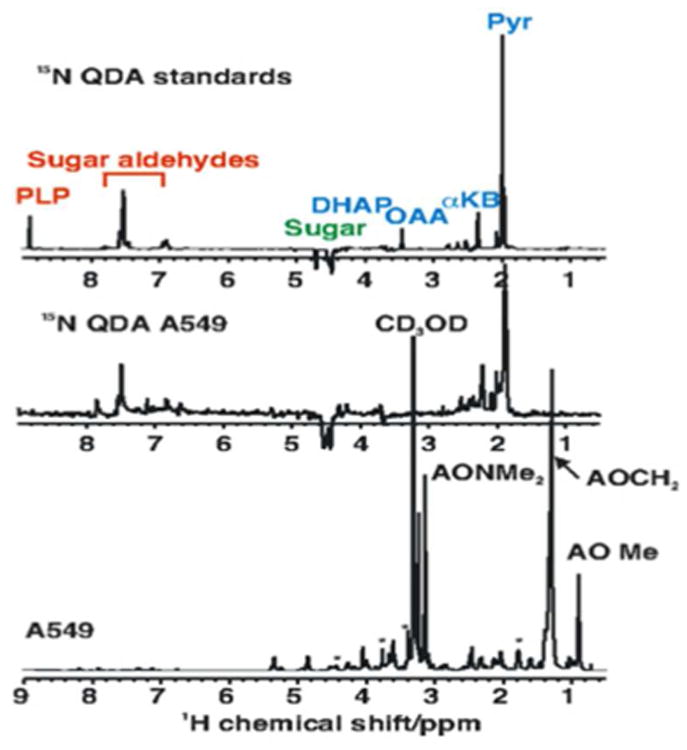
NMR 15N-edited NMR spectra of 15N-QDA adducts of standards and A549 cell extract. The samples were prepared as described in the Experimental Procedures. 1D NMR spectra were recorded at 18.8 T. The 1D 1H-{15N} HSQC spectrum was recorded using an INEPT delay of 3 ms with an acquisition time of 0.5 s and recycle time of 2 s. The 1D unedited spectrum was acquired similarly with an acquisition time of 2 s and a recycle time of 5 s. Total acquisition times were 34 min.
Top : 1D HSQC Spectrum of standards
Middle 1D HSQC Spectrum of the polar extract of A549 cells
Bottom : 1D presat spectrum of the A549 cell extract.