
Figure 3. Long range 1H{15N} HSQC of a mixture of standard 15N-QDA adducts.
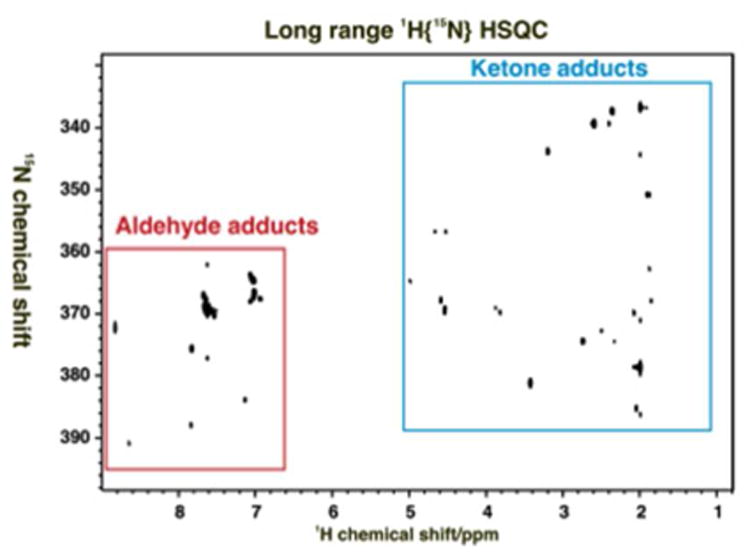
The mixture of 17 standards was dissolved in phosphate buffer. The 15N HSQC spectrum was recorded at 20 °C 18.8 T with acquisition times of 0.15 s in t2 and 0.016 s in t1. The data tables were zero filled once in each dimension and apodised using an unshifted Gaussian function and 1 Hz line broadening exponential. The JNH INEPT delay was set to 83.3 ms.
15N chemical shifts were referenced indirectly with respect to external liquid ammonia [20].
Red and cyan boxes shows resonances from aldehydes and ketones, respectively.