
Figure 5. 1H{15N} HSQC spectra of QDA* adducts of an extract of A549 cells.
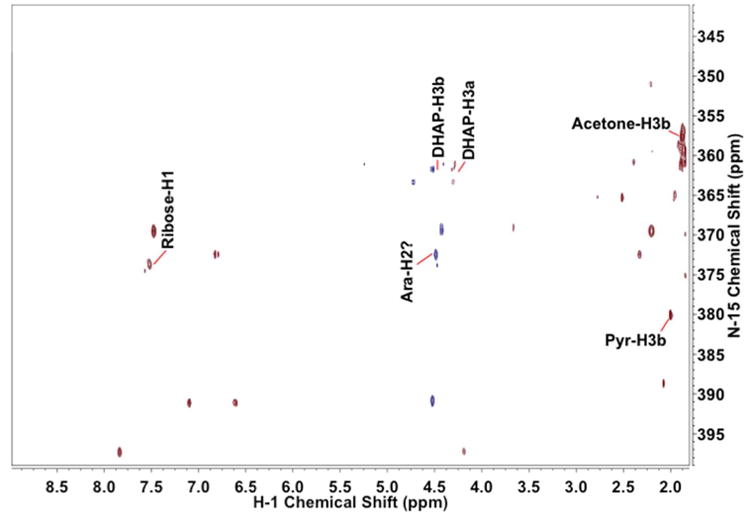
The A549 polar extract was prepared and derivatized as described in the Experimental Procedures. The dried sample was redissolved in 100% CD3OD. HSQC spectra were recorded at 14.1 T with acquisition times of 0.5 s in t2 and 25.6 ms in t1. The data tables were zero filled once in t2, linear predicted once in t1 and zero filled to 8192×2048 points. The free induction decays were processed using an unshifted Gaussian and a line broadening exponential of 4 Hz in both dimensions. 15N chemical shifts were referenced indirectly with respect to external liquid ammonia [20].
Some assignments are shown on the figure.