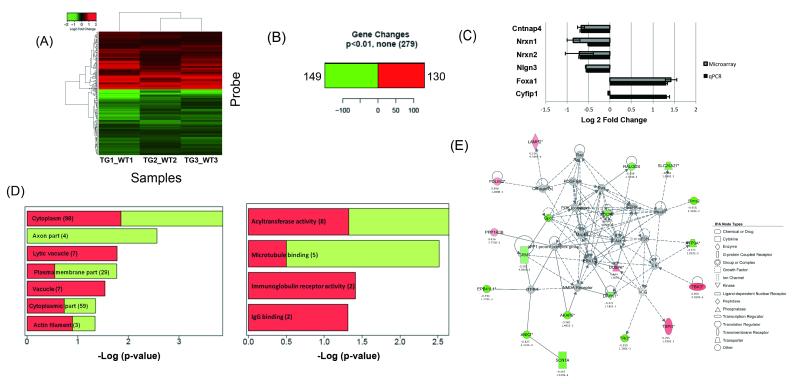
Figure 4. Global expression analyses on embryonic brain in transgenic and control mice identify differentially expressed genes and highlight mTOR.
(A) Heatmap depicting genes differentially expressed between embryonic day 15 Tg #8 Cyfip1 BAC transgenic mice and controls at p<0.01. Here and in all following panels part of this figure, red represents upregulation, whereas green represents downregulation (Log2 scale). (B) 130 genes were found to be upregulated and 149 genes downregulated. (C) Between group differences for five of the top differentially expressed genes, including the autism-related genes Nrxn1 and Nlgn3, were verified by qPCR. Fold changes are expressed as log2 ± standard error. (D) Analysis of all differentially expressed genes (p<0.01) by gene ontology suggests significant enrichment in genes within actin filament and microtubule binding categories (Log2 scale). (E) Ingenuity pathway analysis implicated the mTOR pathway (second “top” network, p=0.05). As above, red corresponds to upregulation, green represents downregulation, and grey genes not differentially expressed. A solid line indicates a direct interaction and a dashed line indicates an indirect interaction. A line without an arrowhead indicates binding. Where arrowheads are present, filled and dotted lines illustrate direct and indirect actions of one protein on another. IPA node type suggests the protein categories.

