
Figure 3.
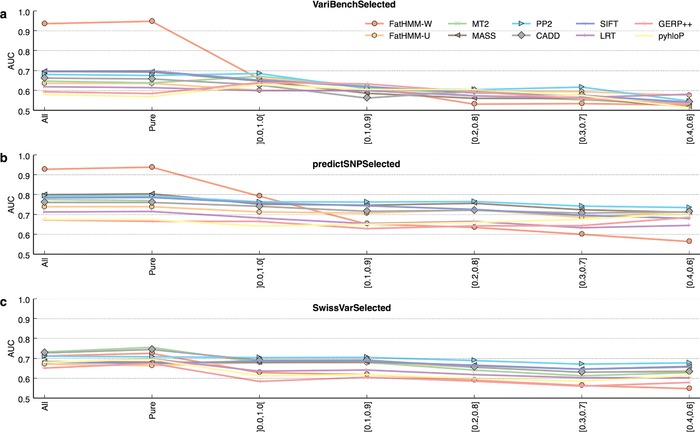
Performance of 10 pathogenicity prediction tools according to protein pathogenic‐to‐neutral variant ratio. Evaluation of tool performance on subsets of VariBenchSelected, predictSNPSelected, and SwissVarSelected, defined according to the relative proportions of pathogenic and neutral variants in the proteins they contain. “Pure” indicates variants belonging to proteins containing only one class of variant. (x and y) indicate variants belonging to mixed proteins, containing a ratio of pathogenic‐to‐neutral variants between x and y. ]0.0, 1.0[ therefore indicate all mixed proteins (the ratios of 0.0 and 1.0 being excluded by the reversed brackets). While FatHMM‐W performs well or excellently on variants belonging to pure proteins (VariBenchSelected and predictSNPSelected), it performs poorly on those belonging to mixed proteins.