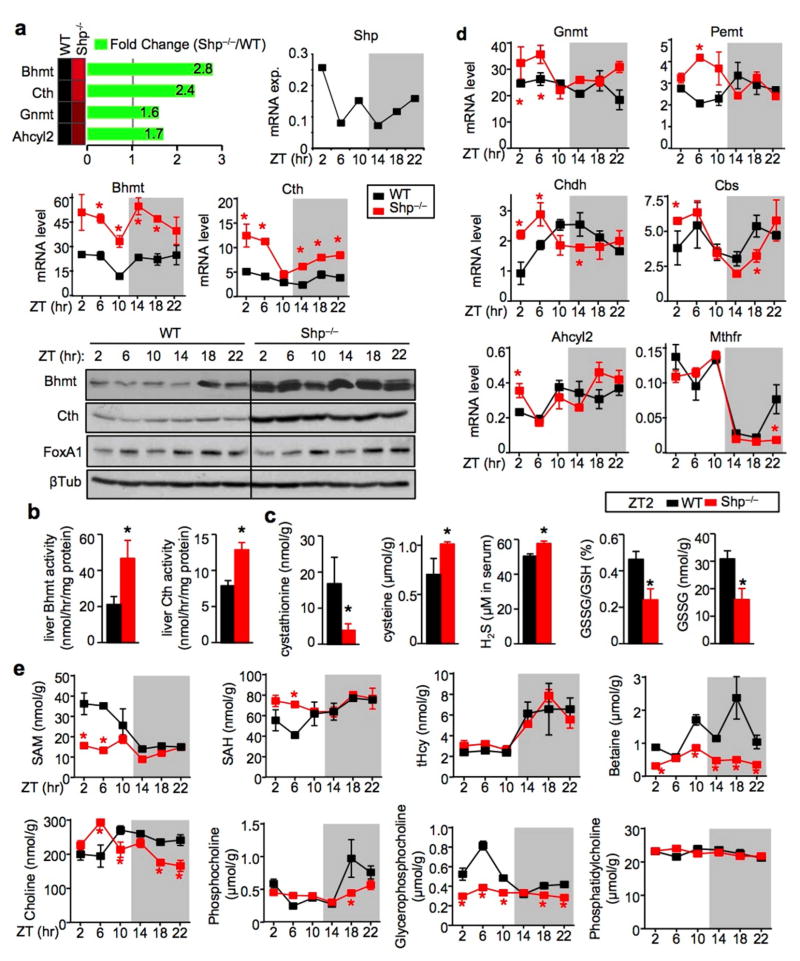
Figure 1. Shp-deficiency disrupts the oscillatory homocysteine metabolic program.
a, Top: RNA-seq revealed upregulation of Hcy metabolic genes in the liver of Shp−/− mice relative to wild-type (WT) mice. Middle: qPCR of hepatic Bhmt and Cth mRNA in Shp−/− (red) and WT (black) mice collected over a 12h/12h light/dark cycle. Data are shown in mean ± SEM. Each time point represents a pooled sample (equal amount of RNA) from 5 individual mice with triplicate assays. *P < 0.01, Shp−/− vs WT at each time point. ZT, Zeitgeber time. Hprt1, internal control. Bottom: Western blot (WB) of hepatic Bhmt, Cth and FoxA1 protein expression in Shp−/− and WT mice collected over a 12h/12h light/dark cycle. β-Tublin (βTub), loading control. Each band represents a pooled sample (equal amount of protein) from 5 individual mice.
b–c, Enzymatic activities of Bhmt and Cth (b) and LC/MS analysis of liver metabolites and serum H2S production as well as HPLC analysis of liver GSH and GSSG (c) in WT (black) and Shp−/− (red) mice at ZT2. Data are shown in mean ± SEM (n=5 mice/group with triplicate assays). *P < 0.01, Shp−/− vs WT.
d, qPCR analysis of the expression of additional genes in the Hcy metabolic pathway. Data are shown in mean ± SEM. *P < 0.01, Shp−/− vs WT. The same condition as in (1a) middle.
e, LC/MS analysis of liver metabolites in WT (black) and Shp−/− (red) mice. Data are shown in mean ± SEM (n=5 mice/group with triplicate assays). *P < 0.01, Shp−/− vs WT.

