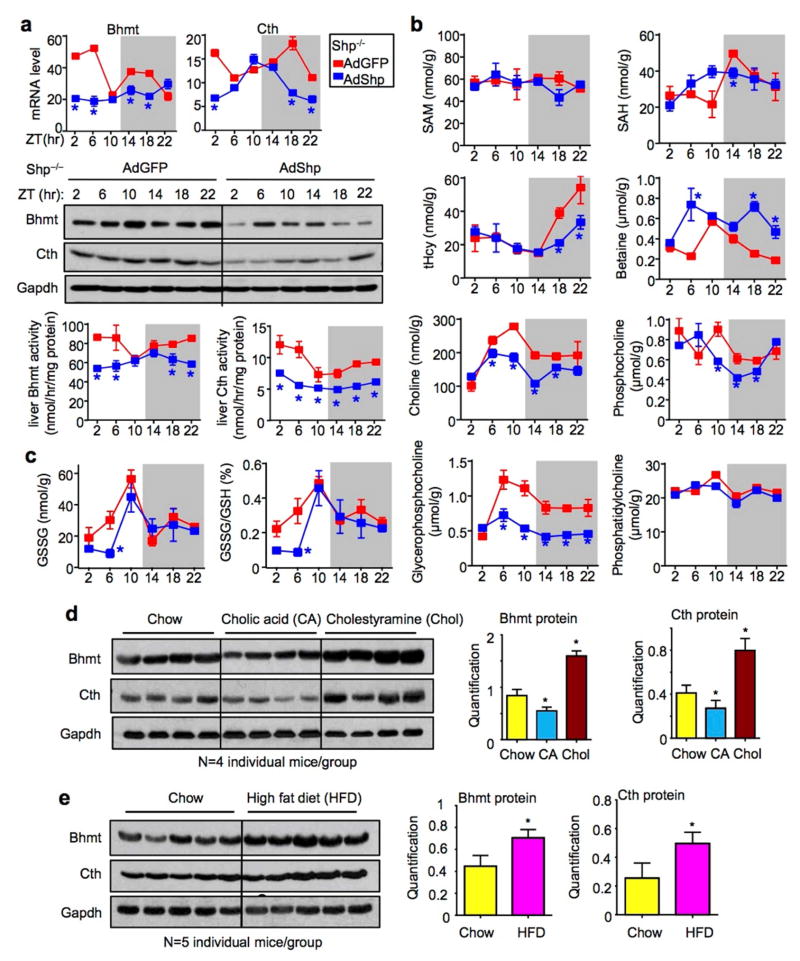
Figure 2. Shp re-expression partially rescues oscillatory one-carbon metabolism.
a, qPCR for mRNA (top), WB for protein (middle) and enzymatic activities (bottom) of hepatic Bhmt and Cth in Shp−/− mice that were re-expressed with GFP (red) or Shp-adenovirus (blue). *P < 0.01, AdShp vs AdGFP. Each ZT time point represents pooled samples from 5 individual mice.
b–c, LC/MS analysis of liver metabolites (b) and HPLC analysis of liver GSH and GSSG (c) in AdGFP and AdShp Shp−/− mice. Data are shown in mean ± SEM (n=5 mice/group with triplicate assays). *P < 0.01, AdShp vs AdGFP.
d–e, Western blot (left) and quantitative analysis (right) of hepatic Bhmt and Cth protein in WT mice fed with 1% cholic acid and 2% cholestyramine (d) or 60% high-fat diet (e). Each line represents one single mouse sample in the indicated genotype group.

