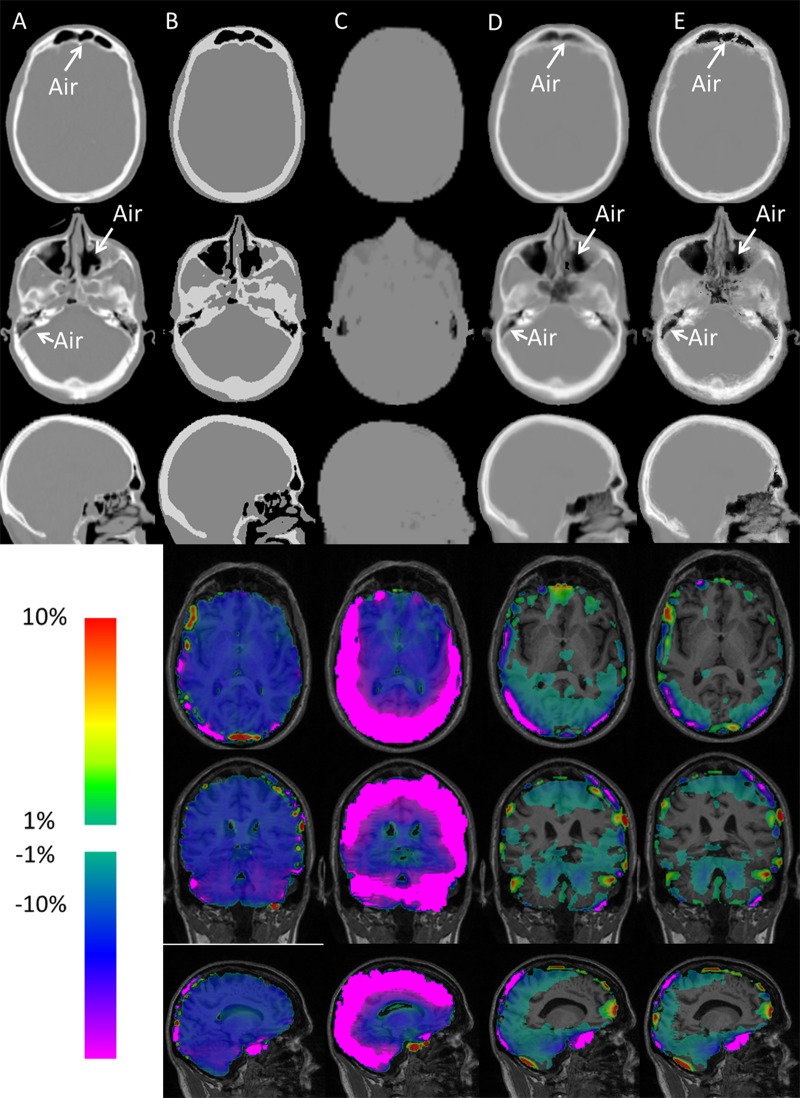
Figure 3:
Representative linear attenuation coefficient μ-maps obtained in the same 71-year-old man as in Figure 2 at the same two axial section locations (upper row and second row, respectively) and one midsagittal location (third row) by using, A, scaled CT, B, CT segmentation, C, Dixon method, D, mean atlas method, and, E, PASSR. Whole-brain percentage error maps were obtained at three orthogonal views (fourth, fifth, and sixth rows) by using μ-maps from, B, CT segmentation, C, Dixon method, D, mean atlas method, and, E, PASSR. Absolute percentage errors below 1% are not shown in color within the brain.

