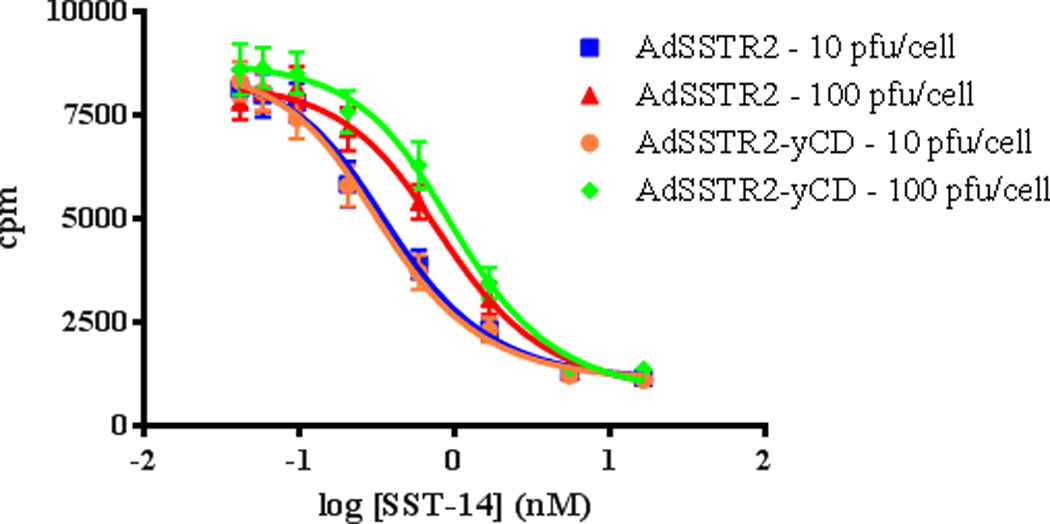
Figure 1.

Representative competitive binding assay curves on MCF-7 cells infected with either AdSSTR2 or AdSSTR2-yCD at 10 or 100 pfu/cell. The data were generated using GraphPad Prism 4 from triplicate cpm measurements for each concentration of ligand.
