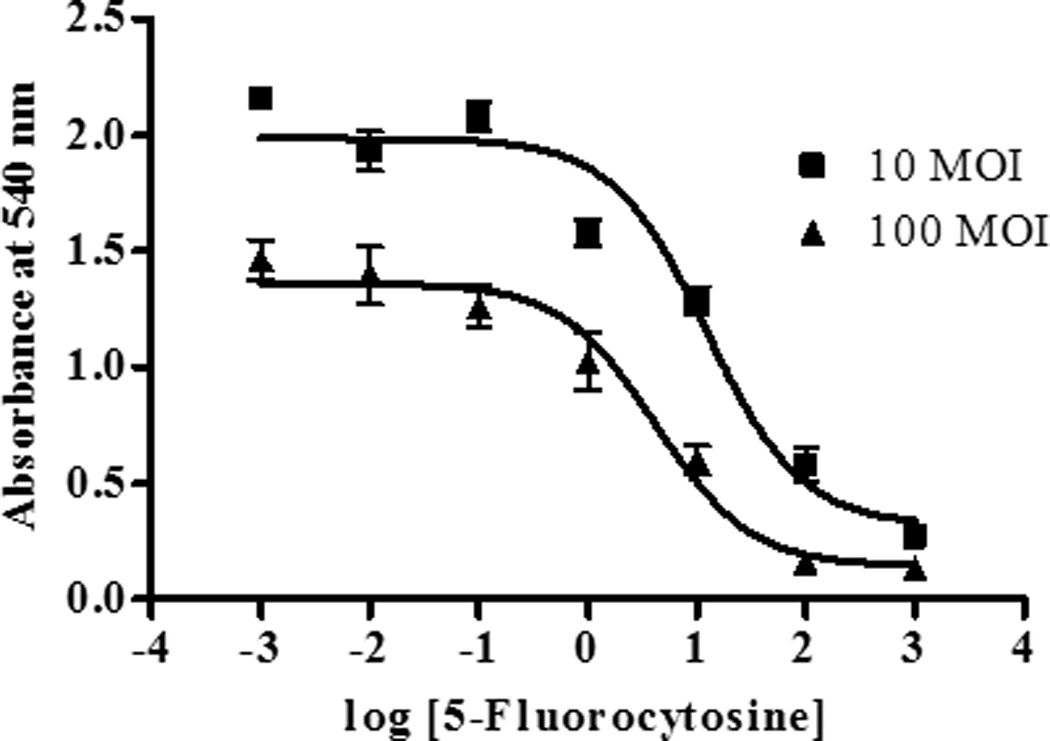
Figure 2.

Cell anti-proliferation data from MCF-7 cells infected with AdSSTR2-yCD at 10 or 100 pfu/cell. The data were generated using GraphPad Prism 4 from triplicate absorbance measurements for each concentration of ligand in which viable cells were fixed and stained with 2% crystal violet in 70% ethanol. The fixed cells were then washed, dried, and the absorbance was measured. The graph is a representative IC50 curve, with each point being a triplicate measurement. The IC50 (µg/mL) values are the mean ± SEM of three experiments, each performed in triplicate.
