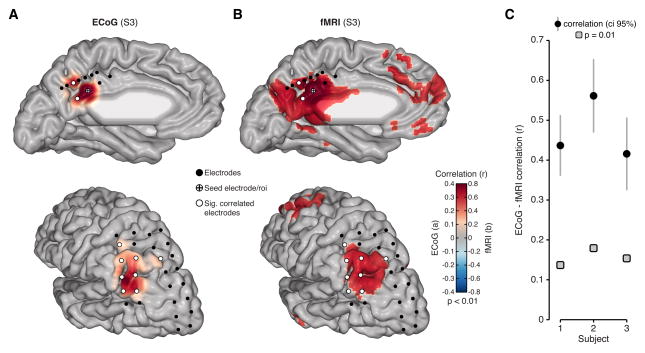
Figure 7. Similarity of ECoG and fMRI resting state connectivity.
A) Resting state ECoG data is shown for an example PCC seed electrode in S3. Based on the seed region in PCC, slow (< 1 Hz) HFB amplitude is correlated significantly and selectively with AG (significant electrodes show white fill color). B) Resting state fMRI data for S3 is shown for the same seed location, but with full brain voxel wise correlation. ECoG electrode locations are overlaid to show correspondence between modalities, whereby significantly correlated electrodes co-locate with significantly correlated voxel clusters. C) For a more comprehensive and quantitative comparison, we correlated parietal connectivity matrices for rsECoG and rsfMRI data. Plot shows the correlation value and 95% confidence interval for connectivity comparisons between rsECoG and rsfMRI in each subject (gray boxes show significance level p = 0.01 based on permutation testing). Modalities were matched by extracting fMRI time series from ROI defined by each subject’s electrode locations (S1–S3 pairs n = 595, 351, 378).

