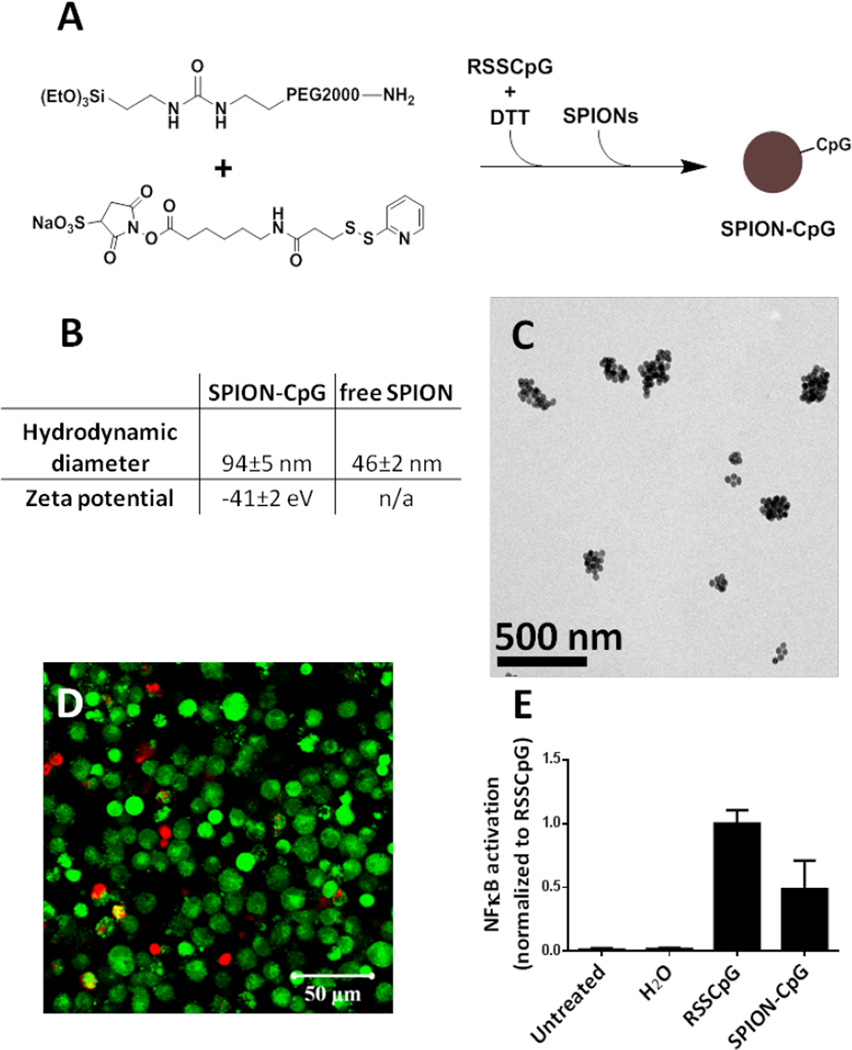
Figure 1.
Synthesis and characterization of the SPION-CpG conjugates. (A) Schematic illustration of the synthesis of SPION-CpG conjugates. (B) Hydrodynamic diameter and zeta potential of SPION-CpG conjugates. (C) Transmission electron microscopy image of the SPION-CpG conjugates. (D) LIVE/DEAD stain of N9 cells treated with 0.5 mg/mL for 12 h. Red = ethidium homodimer (dead), green = calcein AM (live). (E) NFκB activation of RAW-Blue™ mouse macrophage reporter cells treated with 0.1 mg/mL SPION-CpG (n=2, 6 replicates each). The average of the normalized data from two assays is shown.

