Figure 2.
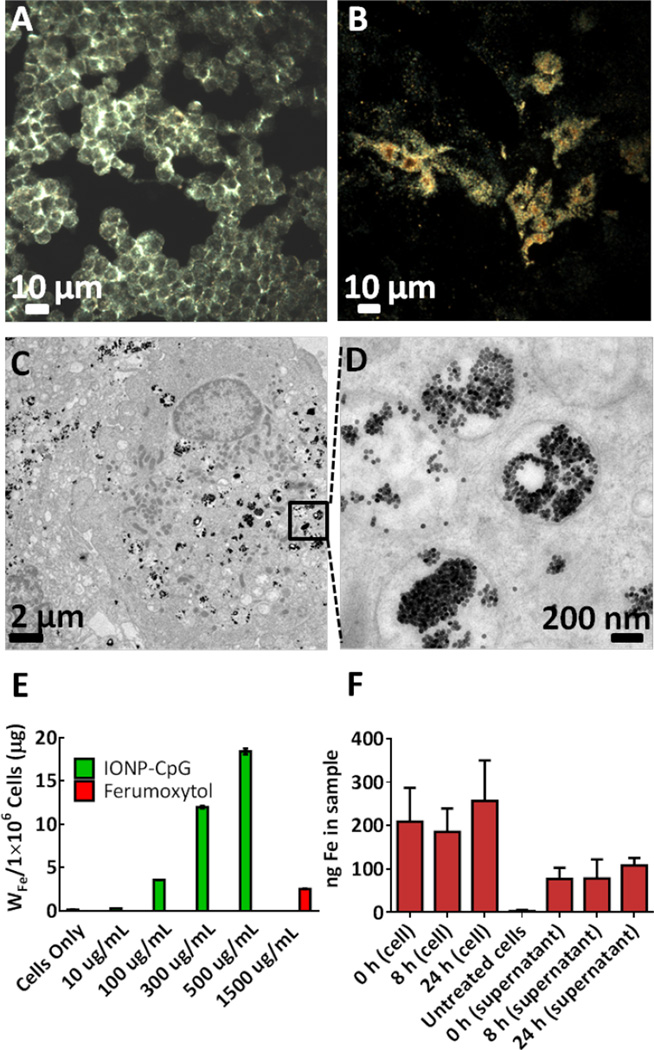
SPION-CpG is internalized in N9 cells. Dark-field images of (A) microglia cells alone and (B) cells loaded with SPION-CpG conjugates [0.5 mg/mL]. (C–D) TEM images of loaded cells. ICP-MS analysis of (E) cells treated with increasing concentrations of SPION-CpG conjugates and Ferumoxytol. (F) Cell and supernatant fractions at various time points after loading (n=2 with treatments performed in triplicate, average of two experiments is shown). Error bars represent standard deviations of iron content in replicate wells.

