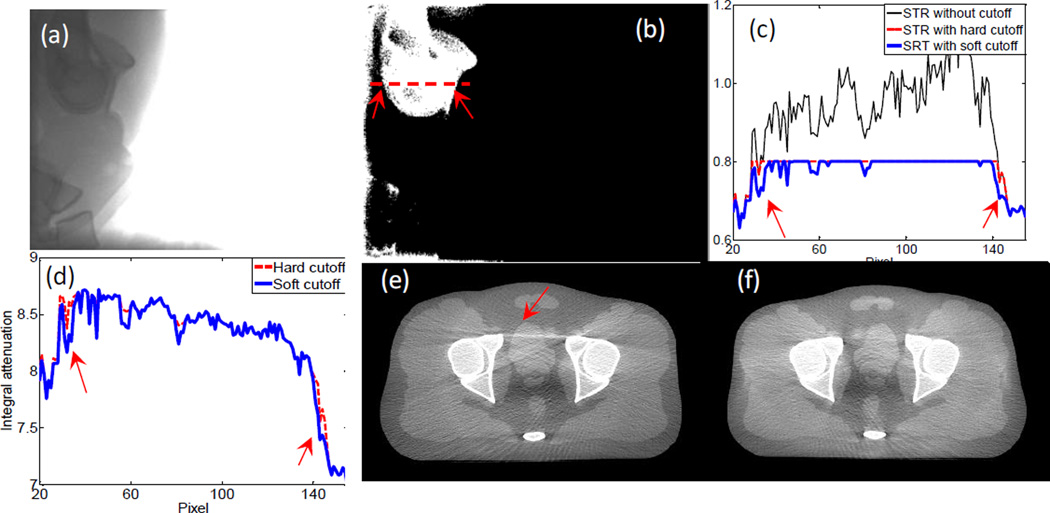
Figure 13.
(a) A measured projection image. (b) A Boolean image showing STR>0.8 (white) or STR<0.8 (black). (c) Profile of STR along the dash line in (b). (d) Corrected primary signal along the dash line. (e) CBCT image after scatter correction with hard cutoff mapping. (f) CBCT image after scatter correction with soft cutoff mapping. Display window [−500 500] HU.

