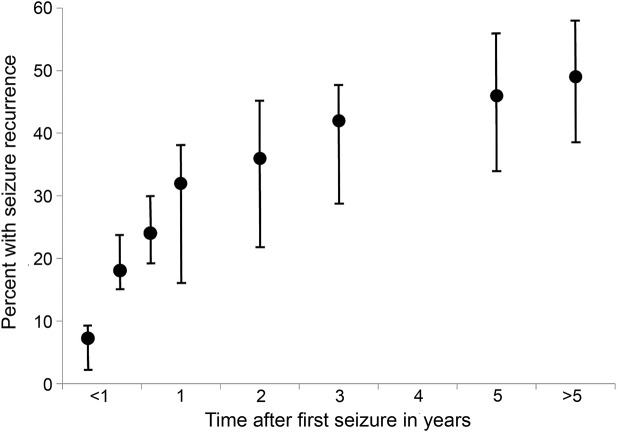
Figure 1. Percentages of patients with first seizure experiencing a recurrent seizure over time.
This graph is based on a fixed-effect pooled percentage model from data in table 1 and shows the cumulative average and the range for each time period from 1 month to more than 5 years.

