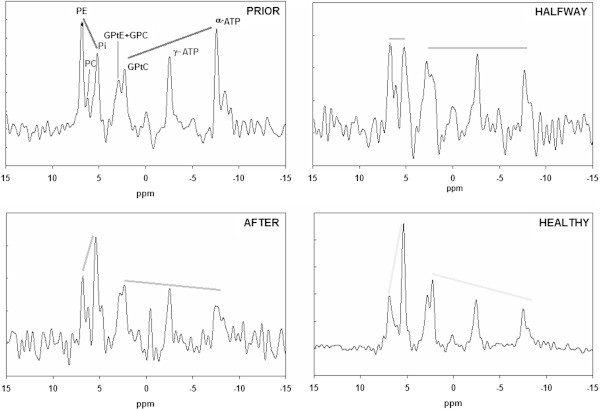
Figure 2.

Patient group FID spectra during neoadjuvant chemotherapy as compared to a FID spectrum of a group of healthy volunteers. Data from healthy volunteers were obtained recently in our group by Stehouwer et al. (2014) and are based on 7 volunteers measured four times with four times larger voxel sizes leading to a high SNR group spectrum. The straight lines emphasize the change in metabolite signal intensities during therapy.
