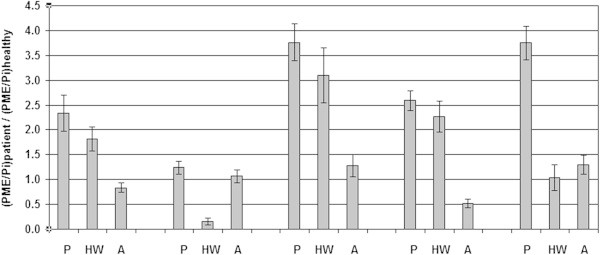
Figure 5.

Individual patient metabolic signal ratios of PME over Pi, during the course of chemotherapy, relative to healthy glandular tissue. P: Prior-; HW: Half Way-; A: After neoadjuvant chemotherapy. For a value of 1.0 the PME over Pi signal ratio of patient equals that ratio in healthy glandular tissue. Note that all patients showed a higher PME over Pi ratio than 1.0 prior to therapy.
