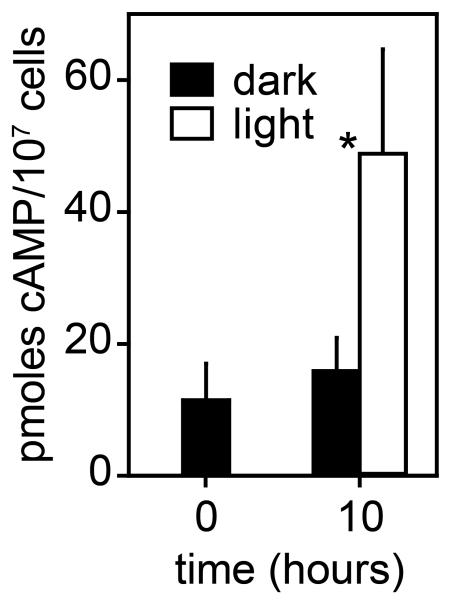
Figure 3. Cell-associated cAMP levels in mPAC transformed cells.
acarg-/A15::mPAC-YFP cells were cultured in darkness, then harvested and incubated for 10 h on non-nutrient agar in darkness or under blue light irradiation. At 0 and 10 h, cells were lysed in perchloric acid and cAMP was measured in the neutralized cell lysates. Means and SD of a three experiments performed in triplicate are shown. The asterix denotes a significant difference between cAMP levels in light and dark samples at P=0.00054, as determined by a t-test.

