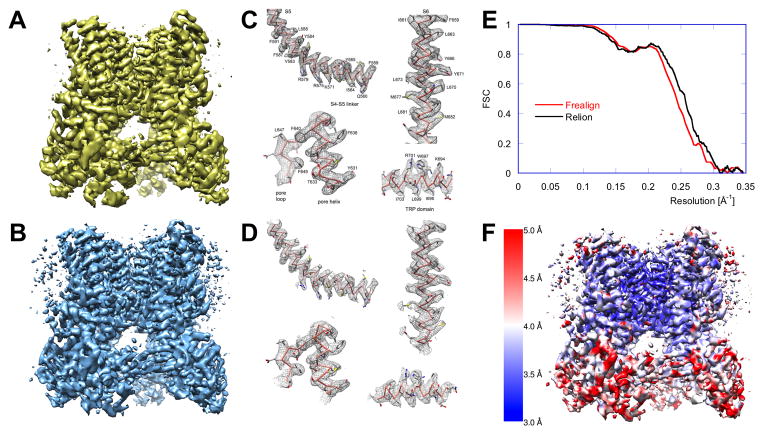
Figure 4. Evaluation and Validation of a 3D EM Structure.
Critical evaluation of EM structural results is of utmost importance due to potential model bias and unavoidable noise alignment inherent to the single-particle EM structure determination method. Ultimate confirmation of the map, particularly of the details at the limit of the resolution claimed, is best done by independent structure determination, possibly using different software packages, even if one uses the same dataset. Here, we show the results of two outcomes for the structure determination of the TRPV1 channel.
(A) Originally, the structure was solved using RELION (Scheres, 2012): the refinement was initialized with an RCT model, and the final map represents the best class produced by 3D MRA (Liao et al., 2013).
(B) The structure determination was repeated using the same 2D dataset. 2D MRA was performed using IMAGIC (van Heel et al., 1996), an initial model was generated using EMAN2 (Tang et al., 2007), and refinement and 3D MRA were done in FREALIGN (Grigorieff, 2007; Lyumkis et al., 2013). For consistency, the rotationally averaged power spectrum of map (B) was set to that of map (A). Interestingly, while the two maps are visually very similar, only ~60% of particles in the best class determined by RELION coincide with those in the best class determined by FREALIGN. This difference likely reflects limitations of K-means-based clustering approaches and, possibly, points to the fact that the number of classes used was too low.
(C,D) The side-chain densities in the best parts of the map shown in (A) agree with those of the map shown in (B), validating these details. However, some weaker peripheral density features in the maps shown in (A) and (B) exhibit noticeable differences (see also Supplemental Information and Figure S2).
(E) Angular uncertainty and blurring affects the FSC curves, and thus the resolution reported: calculation of 3D reconstructions using multiple, probability-weighted copies of each particle image (“soft matching”, see Supplemental Information) can lead to an apparent improvement in the resolution (RELION, black curve) while hard matching yields more conservative results (FREALIGN, red curve). The difference is, however, too small to affect the interpretation of the maps and also lies within the general uncertainty bounds of the FSC methodology, which also depends on other data-processing steps, as, for example, masking of the map.
(F) The resolution of the map is non-uniform. The local resolution of the map shown in (B) was calculated (Penczek, 2014c) and indicates that densities within the membrane domain, and particularly around the pore, are better resolved than those in the extracellular domains. 3D maps were rendered using UCSF Chimera (Pettersen et al., 2004)

